A stack trace for your OS
by Technocoder
What?
A stack trace displays the location of every function call, leading up to when the stack trace itself is called. Essentially, it tells you the path your code took.
Why?
A stack trace is incredibly helpful for debugging purposes as there can be multiple paths to a function call. It is important to determine which path caused a function call.
Where?
In exampleOS we automatically print a stack trace whenever the kernel panics.
How?
There are two ways debuggers print a stack trace. They can either parse the DWARF debugging format which is produced by the compiler, or they can “walk the stack” by following the stack base pointers. exampleOS uses the latter method as it is far simpler and works without loading the kernel symbols. This allows us to produce a stack trace even in the very early stages of the kernel booting process.
The call instruction
Functions are called using the assembly call instruction:
call a_function
a_function is replaced by the address of the the function during
the linking stage. More importantly, is how the call instruction works.
When the processor reaches the call instruction, it saves the current instruction pointer onto the stack. This is called a “return address”. This is so it knows where to continue once the called function has returned. We use this later to print the location of the function call. When the called function returns, the processor examines the stack, pops off the return address, and jumps to the return address.
The frame pointer
Compilers have an option to add frame pointers to every function. When frame pointers are enabled, two important assembly instructions are inserted at the start of every function:
push rbp
mov rbp, rsp
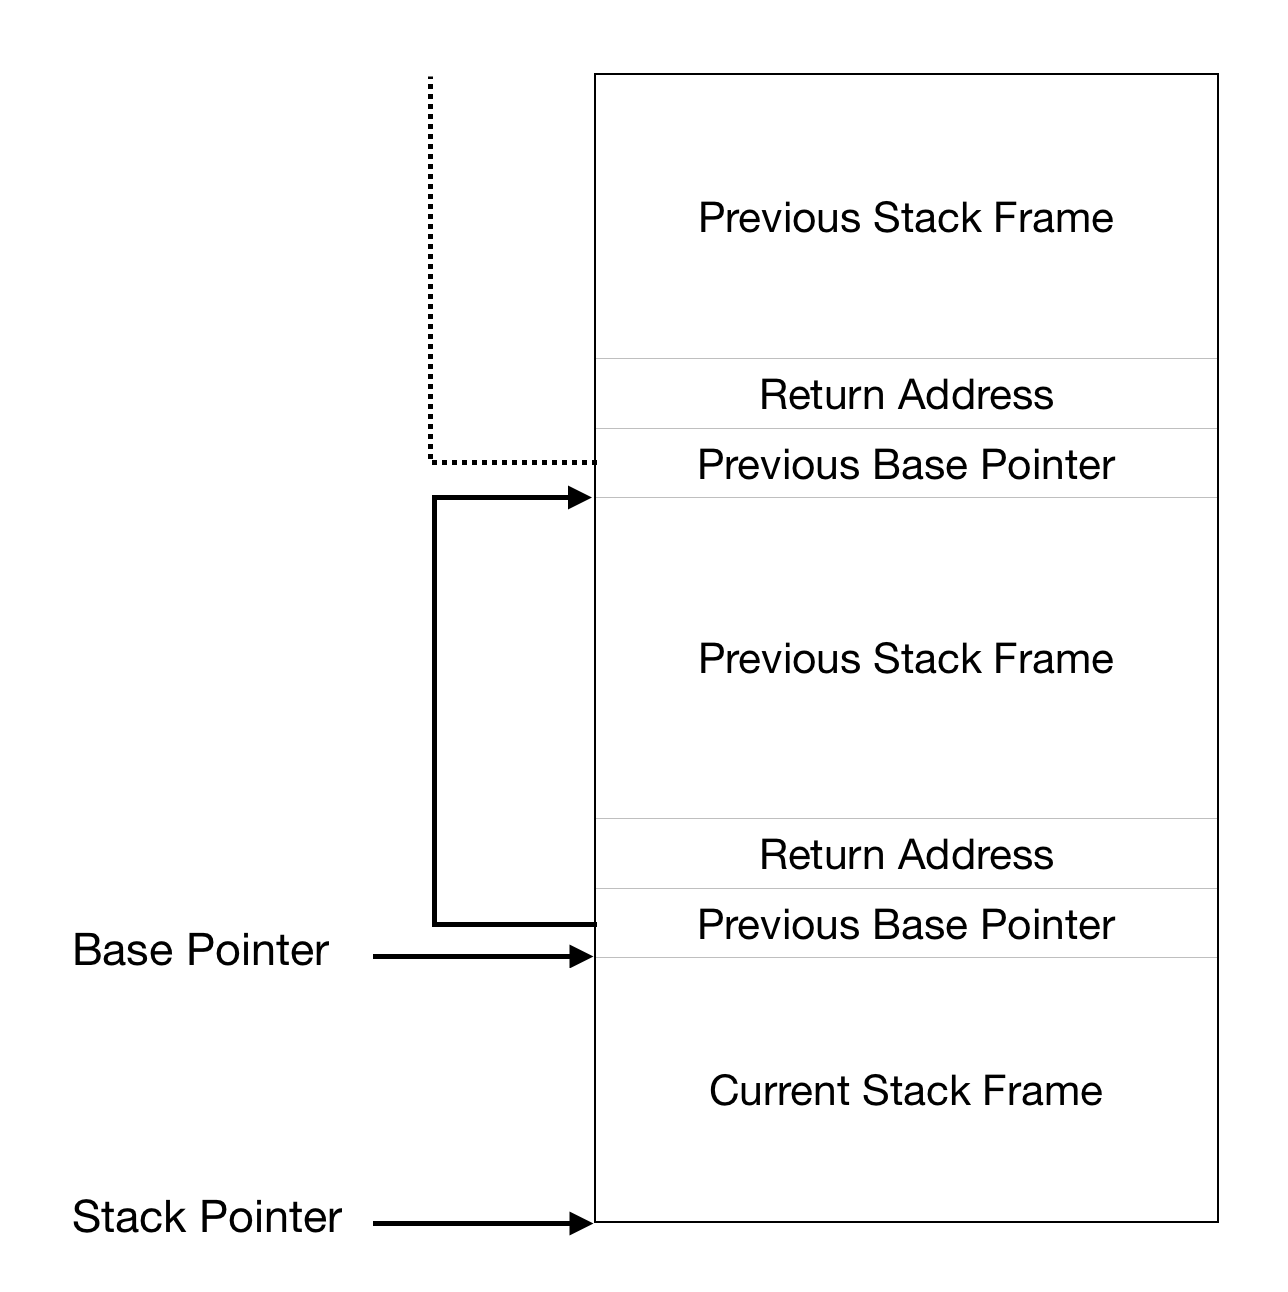
This is what the stack looks like when a function is called:

From the diagram, we can see that the return address is always above the
address stored in rbp. So, in order to find the last function’s
return address, we just add 8 (because registers have a size of 8 bytes in
long mode) from the address stored in rbp.
Enabling frame pointers
The Rust compiler has a flag to enable frame pointers:
RUSTFLAGS=-Cforce-frame-pointers=yes
This is referenced in the compiler source here.
For C and C++ compilers, the search term is no-omit-frame-pointer.
The code
You can see exampleOS’s full implementation of a stack tracer here.
First we have to obtain the contents of the rbp register:
let mut base_pointer: *const usize;
unsafe { asm!("mov rax, rbp" : "={rax}"(base_pointer) ::: "intel") }
Then, to get the return address, we increment the pointer and dereference it:
let return_address = unsafe { *(base_pointer.offset(1)) } as usize;
println!("Call site: {}", return_address);
We increment by 1 because offset is based on the size of the data type (usize,
which has a size of 8 bytes) not the number of bytes. Note that in Rust, dereferencing
a raw pointer is considered unsafe.
Finally, we need to “walk the stack” and get the return addresses of all the previous stack frames. To do this, we set the current base pointer to the previous stack frame’s base pointer:
base_pointer = unsafe { (*base_pointer) as *const usize };
and then we just repeat all the previous code, giving us a nice loop:
let mut base_pointer: *const usize;
unsafe { asm!("mov rax, rbp" : "={rax}"(base_pointer) ::: "intel") }
loop {
	let return_address = unsafe { *(base_pointer.offset(1)) } as usize;
	println!("Call site: {}", return_address);
	base_pointer = unsafe { (*base_pointer) as *const usize };
}
Isn’t this an infinite loop?
That’s right, this loop is going to continue forever, until it dereferences an invalid memory address (and makes the processor throw a fault). This is because we don’t know when the stack ends. There’s a simple solution to this: before we enter the kernel function, set the base pointer to zero, and then stop looping when reaching a base pointer that is equal to zero.
Here’s the relevant file in exampleOS: boot_entry.asm, specifically, this line:
xor rbp, rbp
Now when the boot_entry function is called, a value of 0 will be pushed
onto the stack. All we have to do is update our loop:
// ...
while !base_pointer.is_null() {
	// ...
}
Put everything into its own function and then you’re done!
Final thoughts
For now, you’ll only see numbers in the stack trace. You can use objdump to
map these numbers to the assembly code of your kernel. Later on, we’ll be able
to load the kernel symbol table and then print out function names. exampleOS’s
stack trace implementation does this.